It’s not a day to celebrate:


It’s not a day to celebrate:
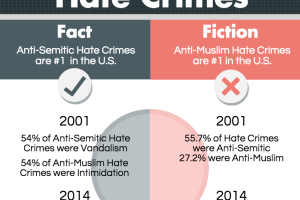
Often, the narrative is that Muslims are more persecuted than other religious groups. However, the statistics tell a different story:
Check out our latest infographic on the lack of results from higher education:

Were you ever curious how much American taxpayers subsidize an abortion provider like Planned Parenthood? Here are the numbers:
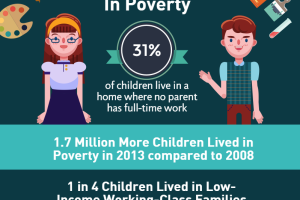
What economic recovery?
Three universities contributed to a study that shows that children are faring badly in the Obama years, although they stop short of questioning the official unemployment rate. The 2015 Kids Count Data Book, published by…
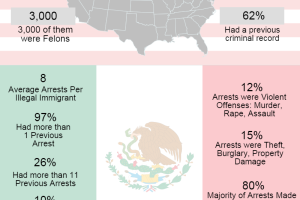
After the Kate Steinle murder at the hands of an illegal immigrant, Hans von Spakovsky dug into the numbers and found the following, which we’ve put into an infographic:
Tired of hearing the same liberal rhetoric of a gender pay gap/equal pay gap? Here’s an infographic to explain why it’s a myth:

We found that school choice is really gaining ground in America, which is a good thing. More choices and more options are a good way to go (click to enlarge image):
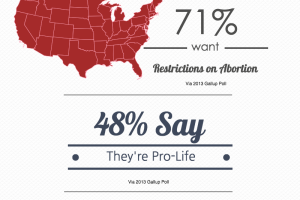
When you dig into the numbers, pro-lifers are gaining momentum (click on the graphic to enlarge):